Welcome to BIOSTAT 725!
Jan 09, 2025
Welcome!
Meet Prof. Berchuck!
- Education and career journey
- BS in Statistical Science from Duke University
- PhD in Biostatistics from University of North Carolina - Chapel Hill
- Postdoc in Duke Forge: Duke’s Center for Actionable Health Data Science
- NIH/NEI Pathway to Independence Fellow (K99/R00)
- Assistant Professor, Department of Biostatistics & Bioinformatics and Statistical Science at Duke; Faculty Affiliate of Duke AI Health
- Work focuses on developing data science tools to improve patient experience using biomedical data (including EHR)
- Dad of 4 and 6 year old daughters 🙂
Teaching Assistants (TAs)
- Dr. Youngsoo Baek (PhD)
- Phd in Statistical Science from Duke University
- Postdoc in Biostatistics & Bioinformatics
- Braden Scherting
- Phd candidate in Statistical Science
Check-in on Ed Discussion!
Click on the link or scan the QR code to answer the Ed Discussion poll
https://edstem.org/us/courses/68995/discussion/5942168

Topics
Introduction to the course
Syllabus activity
Review of probability
BIOSTAT 725
What is Bayesian Health Data Science?
Bayesian Health Data Science involves using Bayesian methods to analyze health data, which can include electronic health records (EHR), clinical trial data, and other health-related datasets. These methods are model-based and can appropriately quantify and propagate uncertainty, making them suitable for tackling challenges in health research.
Source: ChatGPT
Why Data Science?
- Statistics versus Data Science?
- Introductory Bayesian statistics courses are often very mathematical and involve intense computation; thus Bayesian methods are not as frequently used in applied settings.
- Modern software now exists to lower the mathematical burden and computational intensity of Bayesian statistics, but courses do not reflect this.
- This course focuses on teaching students Bayesian statistics as a tool for research; or anywhere data science is practiced.
What is BIOSTAT 725?
Bayes
Modeling
+
Stan
Probabilistic Programming
Prerequisites: BIOSTAT 724 (Introduction to Applied Bayesian Analysis) or equivalent course with instructor permission.
Course learning objectives
By the end of the semester, you will be able to…
- understand fundamental concepts of Bayesian statistics, including prior and posterior, and predictive distributions,
- implement the Bayesian workflow, including model building, checking, and refinement,
- use probabilistic programming software for Bayesian analysis (e.g., Stan),
- apply Bayesian techniques to real-world health data,
- communicate Bayesian analysis results effectively to both technical and non-technical audiences, and
- identify opportunities for using Bayesian statistics in your research and/or job.
Course topics
Linear regression
- Methods for inference
- Prior elicitation
- Posterior estimation
- Uncertainty quantification
- Model assessment
- Bayesian workflow
- Prediction
Health Datasets
Extensions
- Robust regression
- Regularization
- Classification
- Missing data
Hierarchical Model
- Gaussian processes
- Longitudinal data
- Spatial data
Course overview
Course toolkit
- Website: https://biostat725-sp25.netlify.app/
- Central hub for the course!
- Tour of the website
- Canvas: https://canvas.duke.edu/courses/53305
- Gradebook
- Announcements
- Gradescope
- Ed Discussion
- GitHub: github.com/biostat725-sp25
- Distribute assignments
- Platform for version control and collaboration
Computing toolkit

All analyses using R, a statistical programming language
Inference using Stan, a probabilistic programming language (rstan)
Write reproducible reports in Quarto
Access RStudio through STA725 Docker Containers

Access assignments
Facilitates version control and collaboration
All work in BIOSTAT 725 course organization
Syllabus activity
- Introduce yourself to your group members.
- Choose a reporter. This person will share the group’s summary with the class.
- Read the portion of the syllabus assigned to your group.
- Discuss the key points and questions you my have.
- The reporter will share a summary with the class.
Syllabus activity assignments
Group 1: What to expect in the course
Group 2: Homework
Group 3: Exams
Group 4: Live Coding
Group 5: Application Exercises
Group 6: Academic honesty (except AI policy)
Group 7: Artificial intelligence policy
Group 8: Late work policy and waiver for extenuating circumstances
Group 10: Getting help in the course
Syllabus activity report out
Group 1: What to expect in the course
Group 2: Homework
Group 3: Exams
Group 4: Live Coding
Group 5: Application Exercises
Group 6: Academic honesty (except AI policy)
Group 7: Artificial intelligence policy
Group 8: Late work policy and waiver for extenuating circumstances
Group 10: Getting help in the course
Grading
| Category | Percentage |
|---|---|
| Homework | 40% |
| Exam 01 | 20% |
| Exam 02 | 20% |
| Live Coding | 10% |
| Application Exercises | 10% |
| Total | 100% |
Five tips for success in BIOSTAT 725
Complete all the preparation work before class.
Ask questions in class, office hours, and on Ed Discussion.
Do the homework; get started on homework early when possible.
Don’t procrastinate and don’t let a week pass by with lingering questions.
Stay up-to-date on announcements on Ed Discussion and sent via email.
Probability
This is foundational material that you should have already learned in a previous course. I’m reviewing important concepts that are needed for Bayesian inference.
Review of probability
The goal of Bayesian statistics is to compute the posterior distribution (i.e., the uncertainty distribution of the parameters, \(\boldsymbol{\theta}\), after observing the data, \(\mathbf{Y}\)).
This is the conditional distribution of \(\boldsymbol{\theta}\) given \(\mathbf{Y}\).
Therefore, we need to review the probability concepts that lead to the conditional distribution of one variable conditioned on another.
Probability mass (pmf) and density (pdf) functions
Joint distributions
Marginal and conditional distributions
Random variables
\(X\) (capital) is a random variable.
We want to compute the probability that \(X\) takes on a specific value \(x\) (lowercase).
- This is denoted \(P(X = x)\).
We also might want to compute the probability of \(X\) being in a set \(\mathcal A\).
- This is denoted \(P(X \in \mathcal A)\).
The set of possible values that \(X\) can take on is called its support, \(\mathcal S\).
Random variables - example
Example 1: \(X\) is the roll of a die.
- The support is \(\mathcal S = \{1, 2, 3, 4, 5, 6\}\).
- \(P(X = 1) = 1/6\).
Example 2: \(X\) is a newborn baby’s weight.
- The support is \(\mathcal S = (0, \infty)\).
- \(P(X \in [0, \infty]) = 1\).
What is probability?
Objective (associated with frequentist)
- \(P(X = x)\) as a purely mathematical statement.
- If we repeatedly sampled \(X\), then the proportion of draws equal to \(x\) converges to \(P(X = x)\).
Subjective (associated with Bayesian)
- \(P(X = x)\) represents an individual’s degree of belief.
- Often quantified as the amount an individual would be willing to wager that \(X\) will be \(x\).
A Bayesian analysis makes use of both of these concepts.
What is uncertainty?
Aleatoric uncertainty (likelihood)
Uncontrollable randomness in the experiment.
For example, the results of a fair coin flip can never be predicted with certainty.
Epistemic uncertainty (prior/posterior)
Uncertainty about a quantity that could theoretically be known.
For example, if we flipped a coin infinitely-many times we could know the true probability of a head.
A Bayesian analysis makes use of both of these concepts.
Univariate distributions
We often distinguish between discrete and continuous random variables.
The random variable \(X\) is discrete if its support \(\mathcal S\) is countable.
Examples:
\(X \in \{0, 1, 2, 3\}\) is the number of successes in 3 trials.
\(X \in \{0, 1, 2, \ldots\}\) is the number of patients with COVID in Durham County.
Univariate distributions
We often distinguish between discrete and continuous random variables.
The random variable \(X\) is continuous if its support \(\mathcal S\) is uncountable.
Examples with \(\mathcal S = (0, \infty)\):
\(X > 0\) is systolic blood pressure.
\(X > 0\) is a patient’s BMI.
Discrete univariate distributions
If \(X\) is discrete we describe its distribution with its probability mass function (pmf).
The pmf is \(f(x) = P(X = x)\).
The domain of \(X\) is the set of \(x\) with \(f(x) > 0\).
We must have \(f(x) \geq 0\) and \(\sum_x f(x) = 1\).
The mean is \(\mathbb E[X] = \sum_x x f(x)\).
The variance is \(\mathbb V(X) = \sum_x(x − \mathbb E[X])^2f(x)\).
The last three sums are over \(X\)’s domain.
Parametric families of distributions
A statistical analysis typically proceeds by selecting a pmf that seems to match the distribution of a sample.
We rarely know the pmf exactly, but we assume it is from a parametric family of distributions.
For example, Binomial(10, 0.5) and Binomial(4, 0.1) are different but both from the binomial family.
A family of distributions have the same equation for the pmf but differ by some unknown parameters \(\boldsymbol{\theta}\).
We must estimate these parameters.
Continuous univariate distributions
If \(X\) is continuous we describe its distribution with the probability density function (pdf) \(f(x) \geq 0\).
Since there are uncountably many possible values, \(P(X = x) = 0\) for all \(x\).
Probabilities are computed as areas under the pdf curve \[P(a < X < b) = \int_a^b f(x)dx.\]
Therefore, to be valid \(f(x)\) must satisfy \(f(x) \geq 0\) and \[P(−\infty < X < \infty) = \int_{-\infty}^{\infty} f(x)dx = 1.\]
Continuous univariate distributions
The domain is the set of \(x\) values with \(f(x) > 0\).
The mean and the variance are defined similarly to the discrete case but with the sums replaced by integrals.
The mean is \(\mathbb E[X] = \int x f(x)dx\).
The variance is \(\mathbb V(X) = \int (x − \mathbb E[X])^2 f(x)dx\).
Joint distributions
\(\mathbf{X} = (X_1, \ldots, X_p)\) is a random vector (vectors and matrices should be in bold).
For notational convenience, let’s consider only \(p = 2\) random variables \(X\) and \(Y\).
\((X, Y)\) is discrete if it can take on a countable number of values, such as:
- \(X\) = number of hearts and \(Y\) = number of face cards.
\((X, Y)\) is continuous if it can take on an uncountable number of values, such as:
- \(X\) = birthweight and \(Y\) = gestational age.
Discrete random variables
The joint pmf: \(f(x, y) = P(X = x, Y = y)\)
- \(\sum_x \sum_y f(x, y) = 1\)
The marginal pmf for \(X\): \(f_X(x) = P(X = x) = \sum_y f(x, y)\)
The marginal pmf for \(Y\): \(f_Y(y) = P(Y = y) = \sum_x f(x, y)\)
The marginal distribution is the same as univariate distribution as if we ignored the other variable.
Discrete random variables
The conditional pmf of \(Y\) given \(X\) is \(f(y|x) = P(Y = y|X = x) = \frac{P(X = x, Y = y)}{P(X = x)} = \frac{f(x, y)}{f_X (x)}.\)
\(X\) and \(Y\) are independent if \(f(x, y) = f_X(x)f_Y(y)\) for all \(x\) and \(y\).
- Variables are dependent if they are not independent.
Equivalently, \(X\) and \(Y\) are independent if \(f(x|y) = f_X(x)\) for all \(x\) and \(y\).
Discrete random variables
Notation: \(X_1, \dots, X_n \overset{\mathrm{iid}}{\sim} f(x)\) means that \(X_1, \ldots, X_n\) are independent and identically distributed.
This implies the joint pmf is \[P(X_1 = x_1, \ldots, X_n = x_n) = \prod_{i=1}^n f(x_i).\]
The same notation and definitions of independence apply to continuous random variables.
In this class, assume independence unless otherwise noted.
Continuous random variables
Manipulating joint pdfs is similar to joint pmfs but sums are replaced by integrals.
The joint pdf is denoted \(f(x, y)\).
Probabilities are computed as volume under the pdf: \[P((X, Y) ∈ A) = \int_A f(x, y)dxdy\] where \(A \subset \mathbb{R}^2\).
Continuous random variables
The marginal pdf of \(X\) is \(f_X(x) = \int f(x, y)dy\).
\(f_X\) is the univariate pdf for \(X\) as if we never considered \(Y\).
The conditional pdf of \(Y\) given \(X\) is \[f(y|x) = \frac{f(x, y)}{f_X (x)}.\]
Proper: \(\int f(y|x)dy = \int \frac{f(x,y)}{f_X(x)}dy = \frac{\int f(x,y)dy}{f_X(x)} = 1\).
Defining joint distributions conditionally
Specifying joint distributions is hard.
Every joint distribution can be written \(f(x, y) = f(y|x)f(x)\).
Therefore, any joint distribution can be defined by,
\(X\)’s marginal distribution
The conditional distribution of \(Y|X\)
The joint problem reduces to two univariate problems.
This idea forms the basis of hierarchical modeling.
Bayes rule
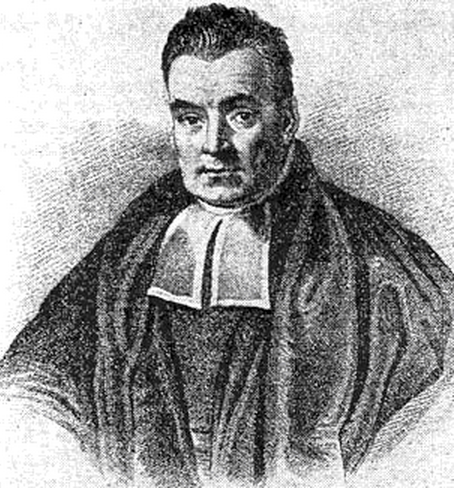
Thomas Bayes, 1701-1761
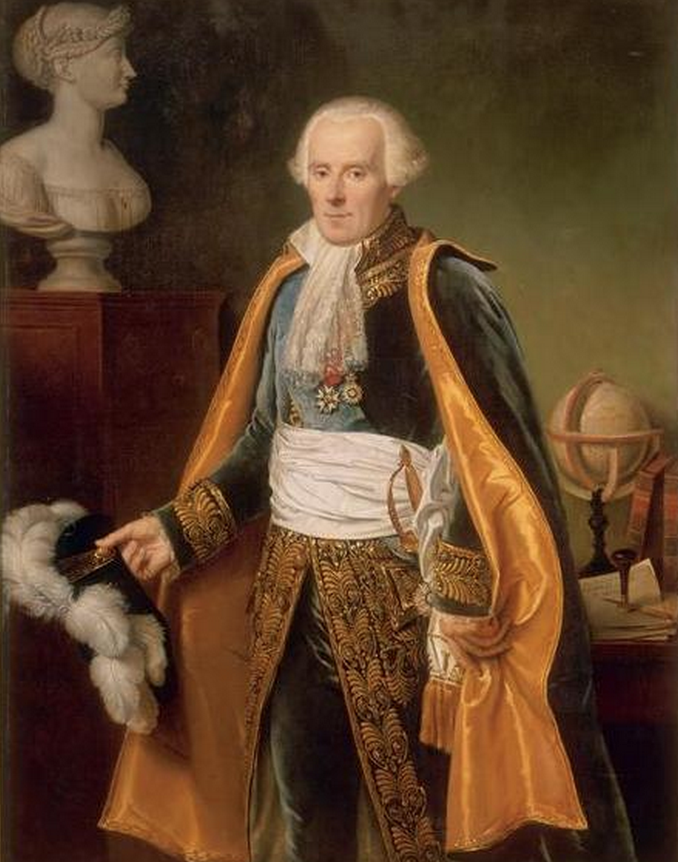
Pierre-Simon Laplace, 1749-1827
\[f(\boldsymbol{\theta}|\mathbf{Y}) = \frac{f(\mathbf{Y}|\boldsymbol{\theta})f(\boldsymbol{\theta})}{\int f(\mathbf{Y}|\boldsymbol{\theta})f(\boldsymbol{\theta})d\boldsymbol{\theta}}\]
Prepare for next week
Complete HW 00 tasks
Review syllabus
Complete reading to prepare for Tuesday’s lecture
Tuesday’s lecture: Monte Carlo Sampling